
Indicators that drive the circular transition
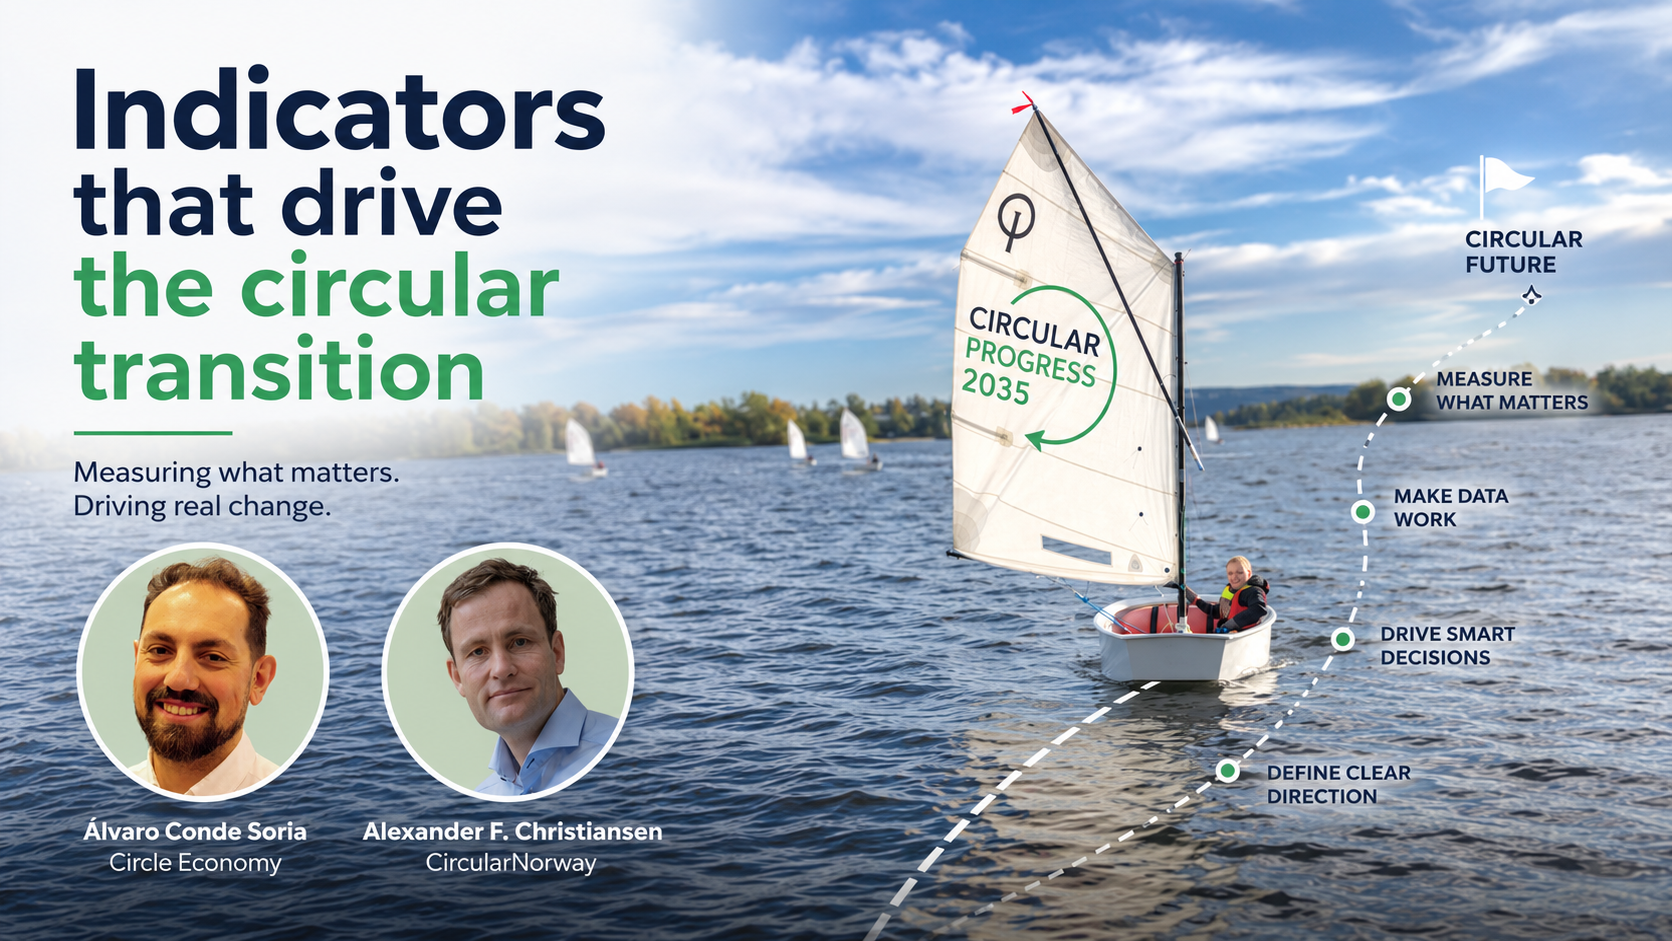
Is Norway 3.3% circular or 2% circular? The answer is: it depends. According to the EU's Circular Material Use Rate (CMUR), Norway's circularity stood at 3.3% in 2022. The Circularity Gap Report Norway, meanwhile, measured it at 2%. Both figures are correct, but they reflect two different ways of measuring circularity. Understanding what different indicators measure is essential for designing policies that target the most significant resource and climate challenges.
By Álvaro Conde Soria (Circle Economy) and Alexander F. Christiansen (Circular Norway)
The distinction matters because materials sit at the heart of today’s economic and environmental challenges. Growing geopolitical tensions, supply chain vulnerabilities and intensifying competition for critical materials have reinforced the strategic importance of resource security. At the same time, material extraction and use drive around 70% of global greenhouse gas emissions and are responsible for over 90% of biodiversity loss and water stress. Yet global circularity remains at just 6.9%. As materials remain fundamental to socioeconomic development and human wellbeing, the challenge is to manage them far more efficiently and circularly. That requires knowing where resource pressures arise, where interventions will have the greatest impact, and how economies are performing against credible benchmarks.
Europe already has a shared starting point. The EU Circular Economy Monitoring Framework provides a harmonised set of indicators covering Production and Consumption, Waste Management, Secondary Raw Materials, Competitiveness and Innovation, and Global Sustainability and Resilience. These indicators are indispensable for high-level policymaking and steering EU-wide investments. They offer a crucial policy compass for tracking the transition across the continent.
A compass provides direction, but navigating a changing landscape requires more than direction alone. Not all circularity indicators measure the same thing, and understanding what different metrics capture is essential for designing effective circular economy policy. Using Norway as an example, this article compares two of the most widely used circularity metrics: Eurostat's Circular Material Use Rate (CMUR) and the Circularity Metric (CM) used in the Circularity Gap Reports. Both track the share of secondary materials in an economy's total material use—but they do so in meaningfully different ways, with meaningfully different results. Together, they provide a more complete picture than either can alone.
Going deeper: What additional indicators reveal
For countries working to accelerate the circular economy, the EU Monitoring Framework is a vital starting point. However, it requires complementary data to enable the granularity that system transformation demands. Measuring circularity is a technically complex, nuanced and limited process. Materials are extracted, transformed, and transported across borders through a series of long, complex, and opaque processes that make their tracking challenging and uncertain. Macro-level circularity indicators, by design, can be difficult to interpret and sometimes fail to capture the full story of global economic and material flows.
The Circularity Gap Report (CGR) aims to navigate this complexity by comprehensively mapping material flows and their associated impacts in a robust and detailed way. The CGR Indicator Sethelps identify where interventions can have the greatest impact, and which sectors hold the greatest potential to optimise material use and reduce associated environmental impacts. This complementary set of indicators is essential for translating policy and business ambitions into measurable, high-impact, on-the-ground action—both at the national level and across industries.
Two approaches to measuring circularity
Even when frameworks share the same goal, they can take meaningfully different methodological paths. This is well illustrated by comparing two headline circularity rate metrics: Eurostat's Circular Material Use Rate (CMUR) and the CGR's Circularity Metric (CM).
At their core, both metrics share the same basic structure: they are rate indicators expressed as percentages that represent the share of secondary materials in total material use. Think of them as fractions: secondary materials in the numerator, total material consumption in the denominator. That shared architecture is what makes them comparable. But it is also precisely where the differences begin, because the two metrics calculate both the numerator and the denominator in fundamentally different ways.
Understanding the differences between them is not a technical exercise—it is essential for interpreting what each indicator actually tells you, what it is suitable for, and how it should be used to guide policy. The differences fall into three areas: how each metric counts secondary materials, how it assigns responsibility for material use, and whether it functions as a standalone indicator or as part of a broader accounting framework.
1. How (secondary) materials are counted
The CMUR counts all materials collected for recycling within a country's borders, crediting the nation that collects them—regardless of where the recycling actually takes place. By contrast, the CM credits the country where recycling actually takes place, not where collection happens. This includes materials that an economy imports for recycling. Waste collected and prepared for recycling abroad is not included in the CM. It may be less feasible for small economies to have domestic recycling facilities, which often results in lower circularity rates under the CM.
The two metrics also differ in the types of materials they include. The CMUR also includes heavy waste flows such as excavated soils and dredging spoils, which can significantly distort comparisons with material consumption data where those flows are excluded. It also includes biological waste that is cycled within the biocycle—such as food composted or manure spread on land. On the other hand, the CM corrects for those heavy waste flows, removing a (potential) source of distortion that the CMUR leaves in place. It only counts biological waste that is cycled within the technical cycle—such as processed wood or cardboard—rather than ecologically returned to nature.
The practical effect is that the CMUR can appear to reward a country for collecting materials, or cycling heavy waste flows and biological waste, in ways that do not reflect meaningful circularity gains. By focusing on where recycling actually happens and on materials that remain in the technical cycle, the CM provides a more consistent measure of circularity.
2. How responsibility for resource use is assigned — and across what scope
This difference mirrors a familiar debate in climate accounting. In emissions reporting, territorial accounting counts what is physically produced within a country's borders. Consumption-based accounting goes further, counting all emissions generated anywhere in the world to satisfy domestic demand. The same question applies to material accounting, and the answer determines what each metric actually measures.
The CMUR is built on Domestic Material Consumption (DMC): materials extracted domestically, plus direct imports, minus direct exports. For open, trade-dependent economies, this understates the true material burden—the raw materials embedded in the production of imported goods remain invisible. The CM is built on Raw Material Consumption (RMC), which traces the full weight of raw materials required to produce what an economy consumes across the entire global supply chain. This makes the CM a life-cycle indicator: rather than stopping at the border, it follows materials from extraction to finished product, wherever in the world that happens. It is also why the UN Environment Programme relies on RMC to track global sustainability under Sustainable Development Goal 12.2—it prevents nations from artificially lowering their apparent footprint by outsourcing material-intensive production elsewhere.
The difference in practice is striking. A finished car weighs roughly 1.2 to 1.5 tonnes — that is what DMC records when it crosses a border. But producing that car requires mining ore, extracting fossil fuels, and processing materials across global supply chains. Under RMC, the true material burden is typically seven to ten times greater—somewhere between ten and 15 tonnes. That gap is what the CMUR cannot see, and what the CM is designed to reveal.
3. A stand-alone indicator or part of a broader set
The third and final difference may be the most underappreciated. The CMUR is primarily a standalone metric. It tells you one thing: what share of an economy’s direct material consumption comes from recycled secondary materials. That headline figure is useful, but it is a ratio without a breakdown. It tells you how circular an economy is, but not why.
The CM, by contrast, is the headline metric within a fully integrated indicator set. Rather than stopping at a single ratio, it provides a systemic diagnosis of an economy’s material flows. Knowing, for example, that 8% of an economy's material inputs are secondary is only the starting point. The same framework also tells you what the remaining 92% consists of: how much is biomass, how much of that biomass has the potential to be ecologically cycled, how much is fossil fuels, how much is going into stock additions such as infrastructure and buildings, and how much raw material has the potential to become secondary in the future. Every major input flow is mapped and accounted for within the same framework.
This additional context transforms a single ratio into a decision-making tool. Rather than knowing only the current share of secondary materials over total material inputs, decision-makers can see where economies are locked into linear patterns, which sectors offer the greatest potential for intervention, and where circular strategies are likely to have the most significant impact on both material use and emissions. The CM does not just measure the gap—it breaks it down and helps identify where and how to close it.
What this looks like in practice: The case of Norway
These methodological differences are not abstract—they can produce strikingly different results in practice. Norway illustrates this clearly.
In 2022, Norway's CMUR stood at 3.3%, while its Circularity Metric was 2%. At first glance, both figures are low. But the difference between them is where the insight lies. The CMUR reflects a relatively favourable view of Norway's domestic recycling efforts relative to its direct material use. The CM tells a stricter story: when you account for the full material footprint—including all raw materials embedded in Norway's imports—recycling covers a much smaller share of what sustaining the Norwegian economy’s consumption actually requires.
The CGR Norway 2025 report puts this in concrete terms: over three-quarters (77%) of Norway's material footprint is generated abroad, showcasing how the Norwegian economy is deeply embedded in global supply chains. That means the vast majority of the total material requirements—and the emissions associated with it—occur beyond Norway's borders. A metric that looks only partially outward will, by design, miss a big part of the picture.
This is not a critique of Norway's performance. It is an illustration of what happens when an open, trade-dependent economy isn't measured using a footprint lens. The same dynamic applies to any economy that imports significantly more than it extracts, which describes most developed economies in Europe.
What both metrics together reveal is more valuable than either alone. The CMUR shows where domestic recycling systems stand and how they compare across EU member states—essential for policy benchmarking. The CM shows the full scale of the challenge and where the real leverage points are. For Norway, that means looking beyond the border: reducing the material intensity of imports, extending product lifetimes, and building circular strategies that address the upstream footprint, not just the downstream waste.
This also has direct implications for climate policy. Because material footprints and emissions footprints are closely linked—extraction, processing and manufacturing are among the most carbon-intensive activities in any supply chain—the CM effectively functions as a proxy for understanding where embedded emissions are concentrated. A country that only monitors its territorial material consumption is, in climate terms, reporting something closer to Scope 1 while remaining largely blind to its Scope 3 exposure. Closing the circularity gap requires closing that visibility gap first.
Norway's current policy momentum makes this especially tangible. For the first time, the government's Grønn bok acknowledges the need to link climate change, resource use and value creation. The launch of a national circular economy mission this year signals that measurement will become increasingly central to strategy. These developments reflect a broader shift—what President von der Leyen has described as an era of geoeconomics, where access to critical materials and robust value chains is a matter of strategic concern. For an open, import-dependent economy, credible indicators are not just a technical requirement. They are a strategic asset.
Complementary by design, not by default
The CMUR and the CM are not competing metrics. They are different instruments built for different purposes, and the temptation to rank them misses the point. What matters is knowing what each one measures, what it omits, and when to reach for which.
The EU Circular Economy Monitoring Framework gives Europe a shared language — consistent, comparable, and essential for tracking progress at scale. The CGR's Circularity Metric adds the consumption-based lens that the EU framework, by design, does not provide: a view of the full material footprint, a direct link to the upstream emissions embedded in trade, and the systemic leverage points that domestic data alone cannot reveal.
Used together, they provide a more complete understanding of circularity. Not as competing perspectives, but as complementary lenses on the same system. Robust circularity measurement is, in the end, a precondition for credible climate action. You cannot reduce what you cannot see.
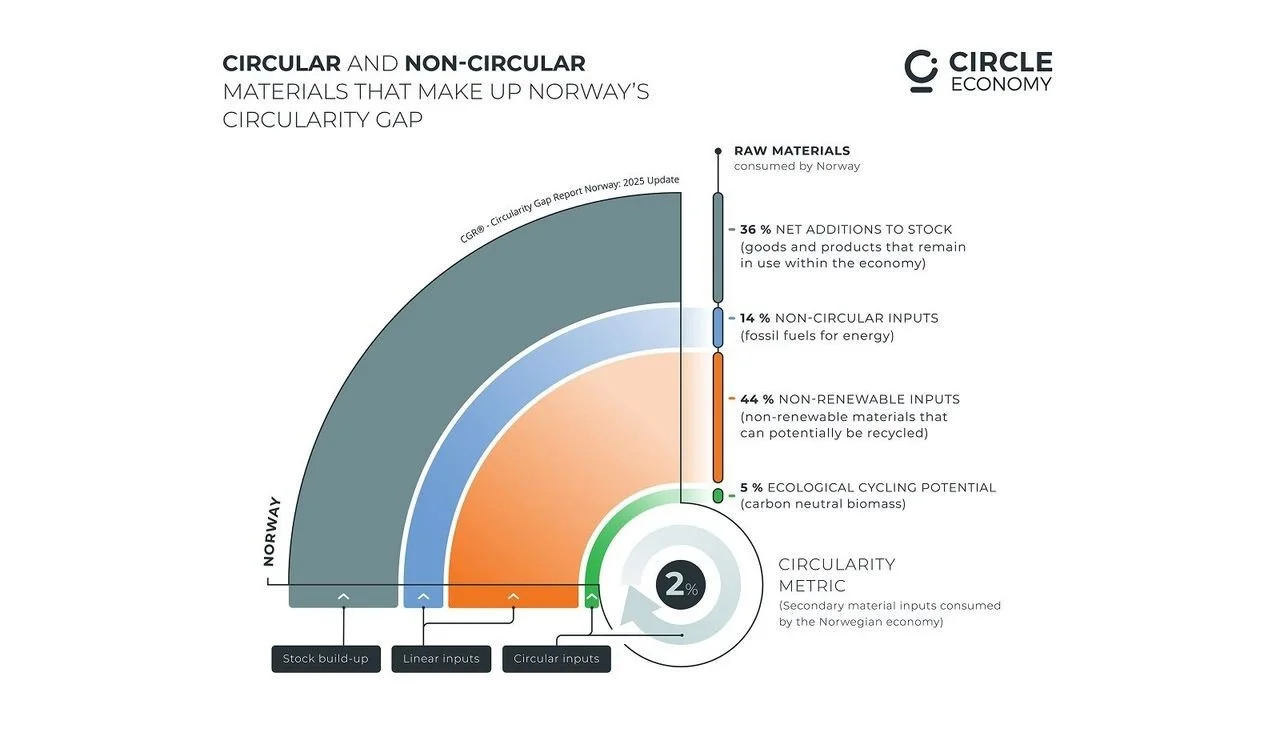
Circular Indicator Set for Norway is based on Circularity Metric.